Thank you for participating in Compulink's sales-data exchange among members of the Jewelry Shopkeeper Maintenance Plan.
Only members who contributed their own sales data are receiving the full merged and summarized results.
First, let's recap that Gross Margin Return on Investment(GMROI) is calculated as:
Gross Profit $'s (on a yearly basis) / Average Inventory Level Maintained
E.g., if the GMROI for Vendor X is 115% it means that if you keep an average investment of $10,000 of that vendor’s items in stock, then each year you are banking $11,500 in gross profit (not sales) while still continuing to own $10,000 of goods from that vendor in your showcases.
By the way, 115% is considered a reasonable GMROI goal for jewelry stores. But since some sales areas are bound to be somewhat lower than that, some other areas will have to be somewhat higher, so shoot for 150% where you can.
The sales figures included this time cover the period September 2014 through April 2015, so to project the sales figures shown to a yearly basis means multiplying by 1.5.
For this first exchange, over 50 retail stores have contributed data. Over 1,500,000 unique Sku's and over 150,000 sales for this time-period have been compiled.
Vendors included in the list are either exhibitors at the JCK Las Vegas show or are vendors reported by at least two different Shopkeeper participants. So uncommon vendors and jewelers’ own in-house custom designs are not included.
Also not included were repairs, sales for vendors that could not be identified or had only one store reporting and some very big watch companies who have sworn their dealers to absolute secrecy.
Each vendor may have a different number of stocking stores so you will see some very different dollar figures for different vendors. Nonetheless, each vendor has been given a ranking in terms of total gross profit ranking which gives you an idea of how popular vendors are, relatively speaking.
Ultimately, the GMROI figure is the most important, but you will notice that a fair number of vendors have excessively high results (making the others look bad by comparison). In most cases this may result from jewelers using memo terms and special ordering. In those cases, the jewelers’ invested inventory is low, even zero, before the item is sold. Of course, this still represents a profitable area of business to target, but it doesn’t necessarily mean you need to invest in keeping those lines in stock at the highest levels.
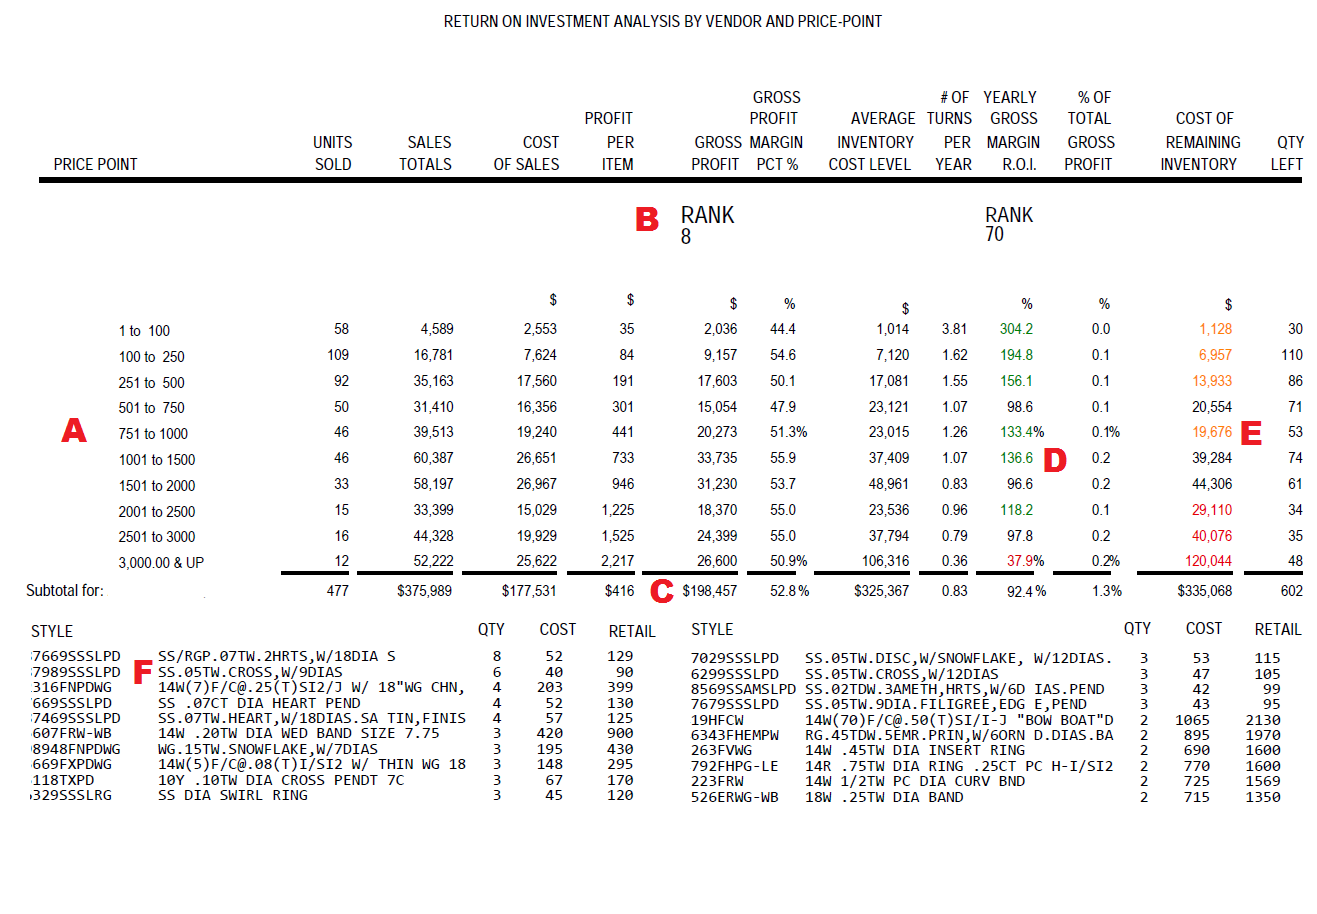
A - Price-point breakdown (each vendor's may be different)
B - Overall Ranking of all vendors in terms of total dollars of gross profit (over 500 in all)
C - Total Gross Profit dollars for Sept 2014 through Apr 2015
D - GMROI Green means over 110% which is good; Yellow means between 110% and 75% which is ok; Red means below 75% which is less desirable.
E - Remaining inventory level (Red means possibly too much inventory for that category Black means close to optimum / Orange means possibly less than an optimum level)
F -Top Selling Styles sorted by quantity sold.
What to consider and to take away from reviewing the results
In some cases the sales quantities are tiny and you can’t make a meaningful projection from a quantity of one or two.
Reviewing the results may give you some ideas on where to invest your dollars and time.
You may notice certain vendors have better results than you would have thought.
You may notice that other jewelers have had success for certain vendors at price-points that you might not have thought that vendor could sell at.
You may notice that it may be safer to invest in lower price-points for other vendors.
You might notice some vendors who could possibly extend memo terms to you.
You might notice some vendors who appear to fulfill special order sales profitably.
For each vendor you'll see some of the top-selling styles, so for the vendors you already carry, see if there are worthwhile models that you don't yet stock. Or, if you're considering a new vendor, you should see if those top styles would suit your store.
Different retailers may have typed in the style numbers slightly differently in which case they would have not matched up perfectly. Or there may be styles which are the same but with slightly different versions which also may not match up. Thus, there are likely to be styles with higher sales figures than show in the report.
Of course, you have to spend more time looking at your own results and be sure to not invest the largest number of dollars in areas with very low GMROI.
Review your oldest inventory to see if you can liquidate it or return it in order to invest in faster-turning sectors.